
This article I originally published on hackster.io and it was featured there. You can find the source code on GitHub.
I was impressed to see how plants grow and I was asking myself if I could measure or visualize this.
There are several methods to measure plants growth but nearly all of them require to kill the plant to gather exact knowledge on the growth. For my experiment an exact measurement is not needed, therefore an approximation would be enough.
My idea was to measure the growth like a hobby gardener would do it: by watching the plant and derive results from it.
I perform the following steps:
- Watching the plants while they grow: Make continuous pictures of the plants
- Gather information about the growth: Use computer vision to gather information from the pictures taken
- Visualize the data gathered: Using data science tools like R to analyze the data
Watching the plants while they grow
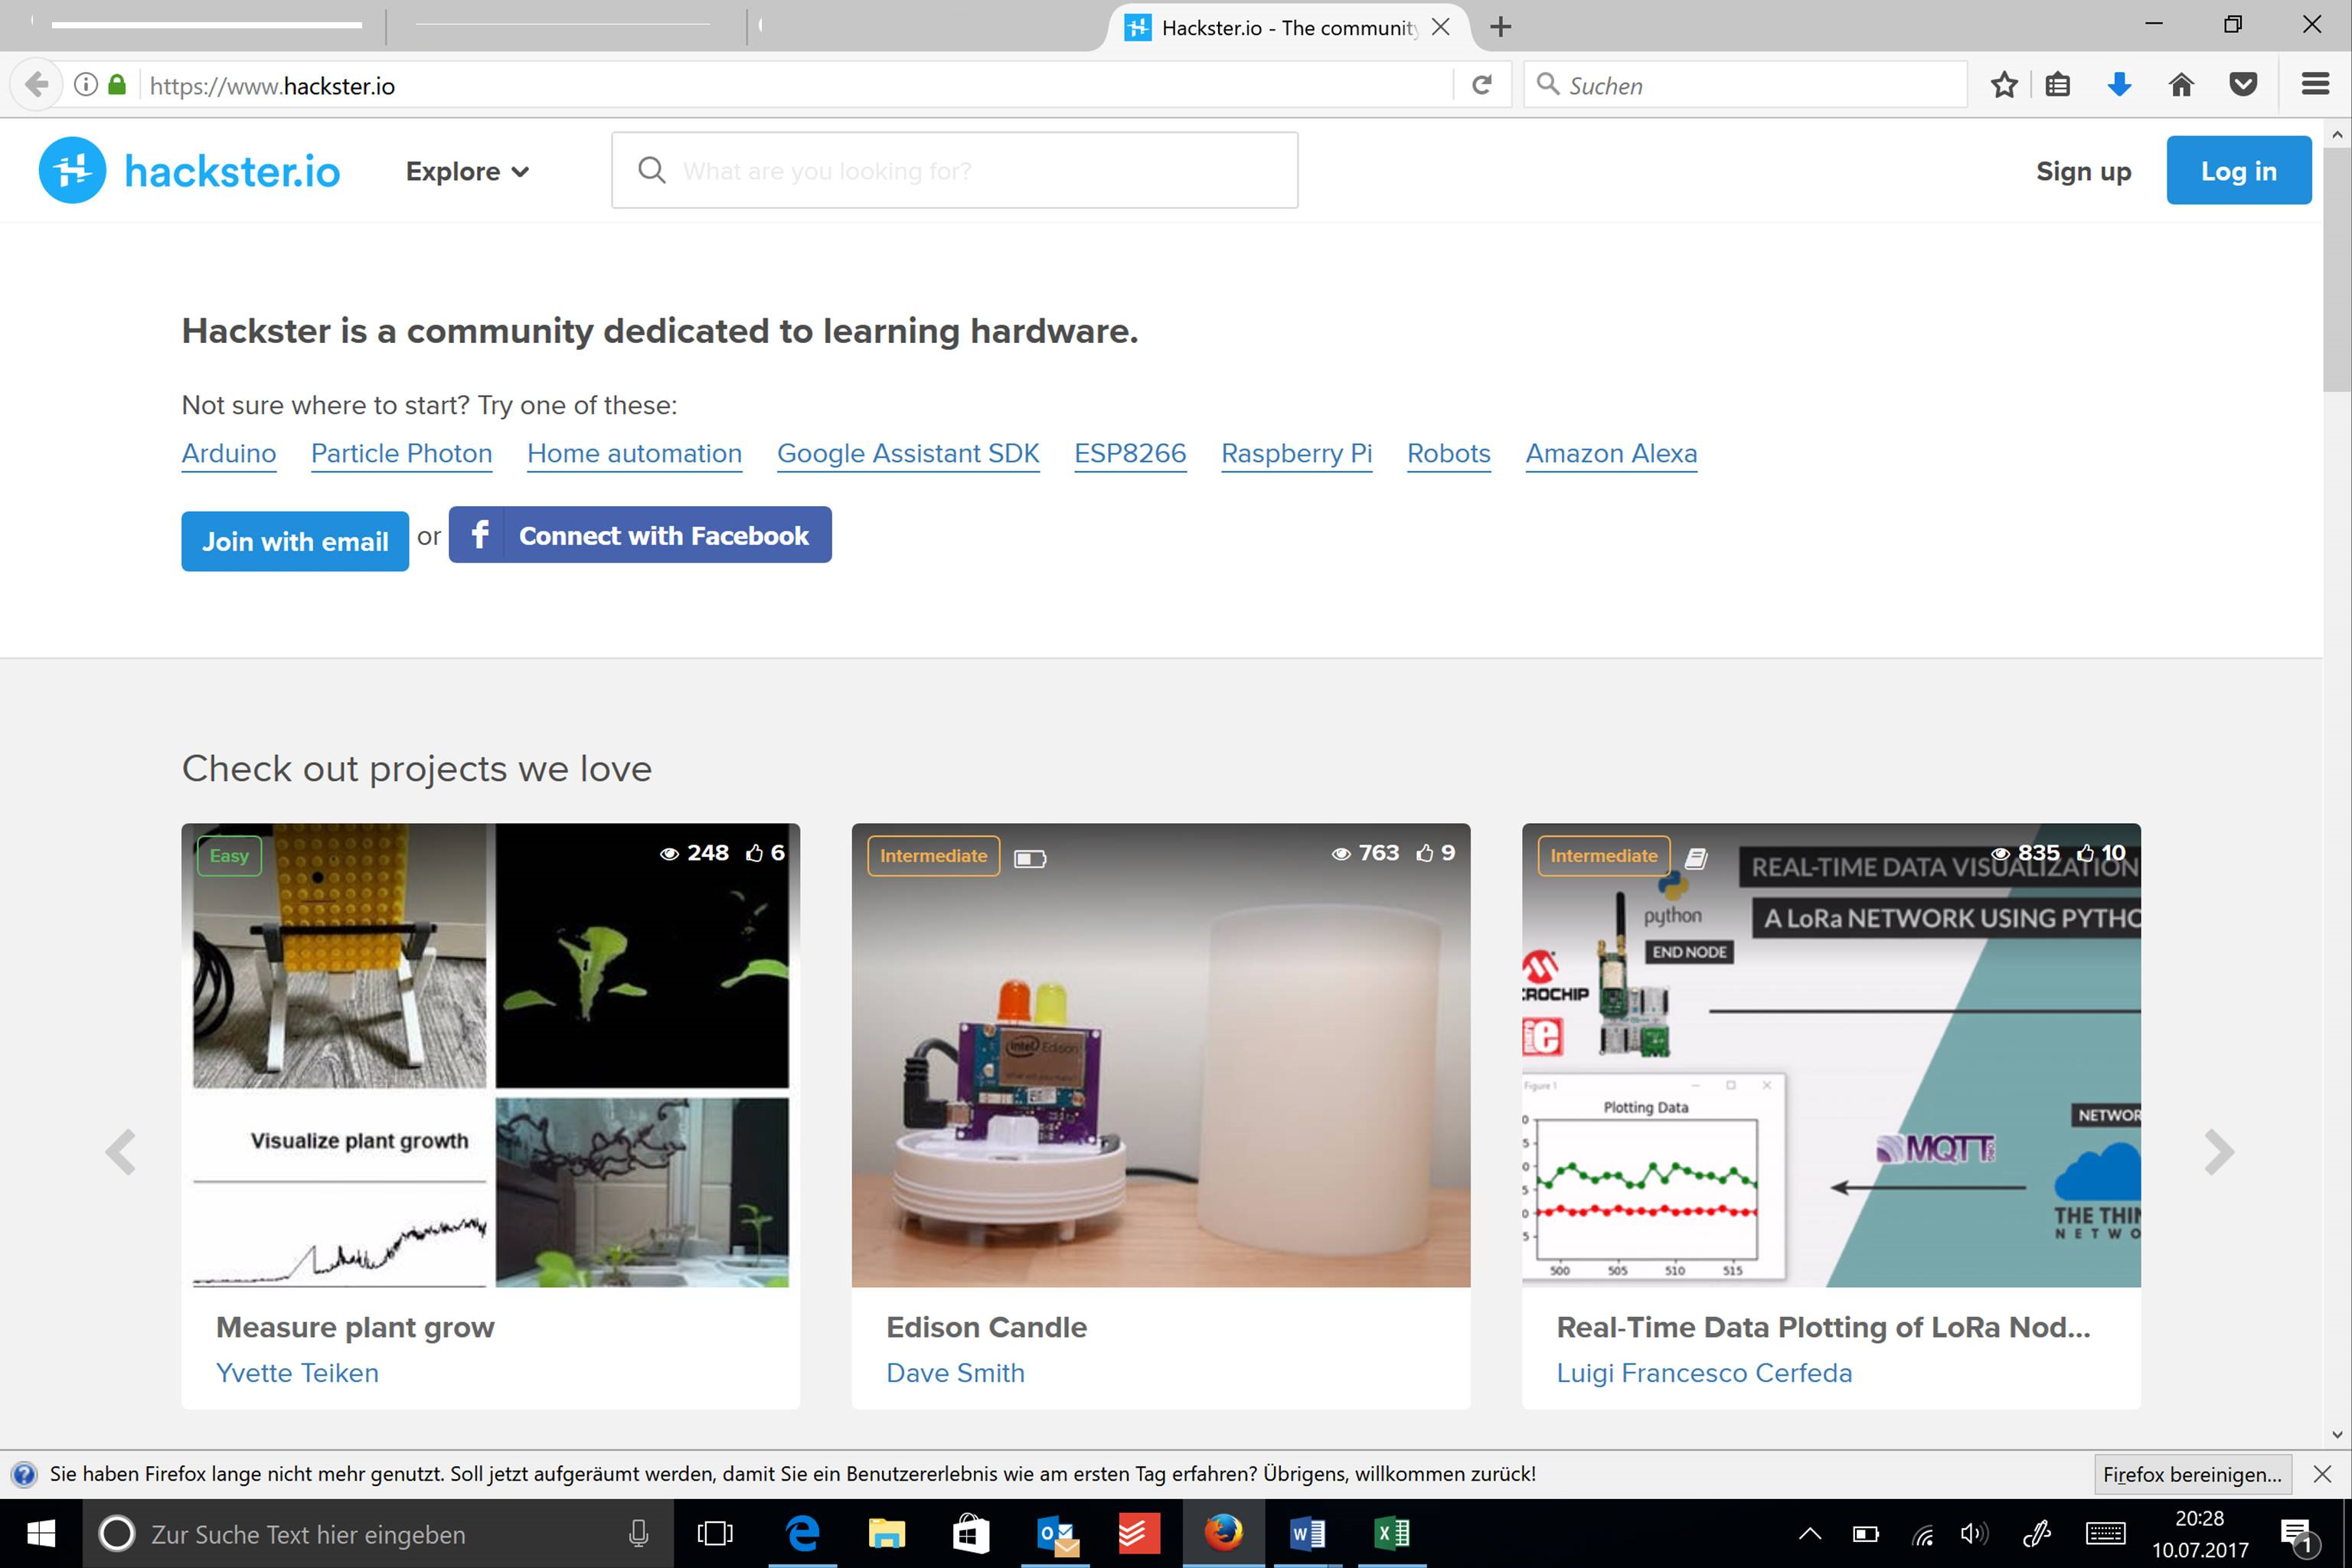
To watch the plants in a controlled environment I used an IKEA indoor grading set with lettuce as plants. To take the images I used a Raspberry Pi 2 Model B with a camera module. I used a Lego stand to adjust the height of the camera to see the whole plant troughs.
To capture images, I use a simple python script which took an image every 10 minutes and store it in the file system. It is important to have the timestamp in the filename because then I can analyze over the time dimension.
with picamera.PiCamera() as camera:

   camera.start_preview(fullscreen=False,window=(400,200,640,480))

   wait()

   for filename in camera.capture_continuous('/home/pi/Desktop/caputre/img{timestamp:%Y-%m-%d-%H-%M-%S}.jpg'):

       print('Captured %s' % filename)

       wait()
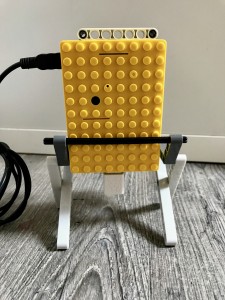
In the picture you can see the pictures taken by the camera one is from the beginning and the other was taken near the end of my observation.
With all the images taken I can start the analysis.
Gather information about the growth
To measure the actual growth I took an approximation method. I count the number of green pixels on every image and then I know the general growth rate. To count the pixels, I use computer vision with openCv. To get started with openCv I used the great tutorial provided by https://www.pyimagesearch.com/practical-python-opencv/.
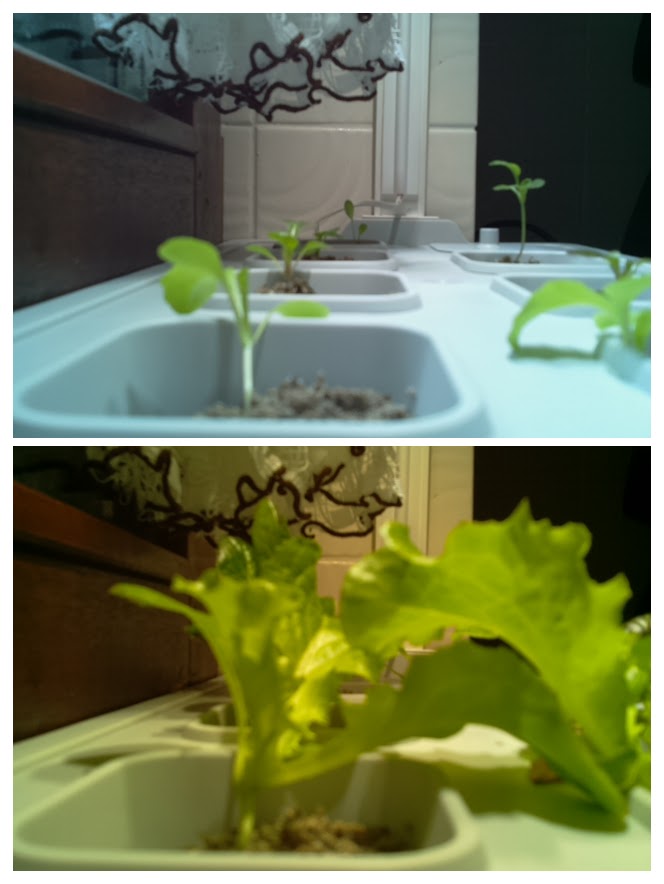
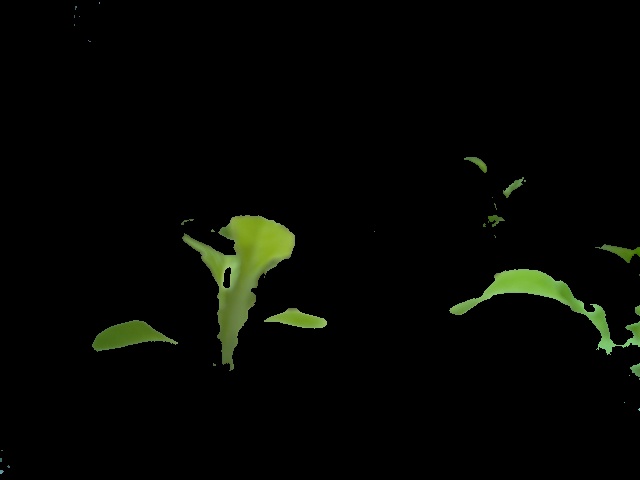
For every picture that was taken I applied a mask which thus only contains green elements. In my case this is the plant. In the picture, you can see a masked one.
For each of these pictures I counted the number of green pixels to estimate the growth. I can do that because I am only interested in a general figure. The number of green pixels are stored in a csv file for later analysis.
   def __init__(self, filename, outputPath):

           self.filename = filename

           self.detectedPixels = 0

           self.outputPath = outputPath

           if not os.path.exists(outputPath):

                os.makedirs(outputPath)

           self.dateString = filename[10:-4]

           self.lower_green = np.array([21,100,100])

           self.upper_green = np.array([110,255,255])

   def maskFileName(self):

           return os.path.join(self.outputPath,( os.path.splitext(self.filename)[0] + "_Mask_" +  os.path.splitext(self.filename)[1]))

   def analysisTimeStamp(self):

           val = time.strptime(self.dateString,"%Y-%m-%d-%H-%M-%S")

           return val

   def resFileName(self):

           return os.path.join(self.outputPath,(os.path.splitext(self.filename)[0] + "_Res_" +  os.path.splitext(self.filename)[1]))

   def analyseImage(self, showResult, storeResult):

           img = cv2.imread(self.filename)

           hsv = cv2.cvtColor(img, cv2.COLOR_BGR2HSV)

           mask = cv2.inRange(hsv, self.lower_green, self.upper_green)

           res = cv2.bitwise_and(img,img, mask= mask)

           self.pixelCount = cv2.countNonZero(mask)

           if(storeResult):

               cv2.imwrite(self.resFileName() ,res)

               cv2.imwrite(self.maskFileName(),mask)

           return self.pixelCount
Visualize the data gathered
For the data written in the csv file I created a simple R plot to see the change over time.
infile <- file.path(dirName, fileName)
eeframe <- read.csv(infile, header = FALSE, stringsAsFactors = FALSE, sep = ",", dec = ",")
xrange <- range(eeframe$V2)
eeframe$V1 <- as.POSIXct(eeframe$V1, format = "%Y-%m-%d %H:%M")
eeframe <- eeframe[order(eeframe$V1,decreasing = FALSE),]
plot(eeframe$V1, eeframe$V2, xlab = "time", ylab ="growth by count of pixels", main="Visualize plant growth", type = "l")
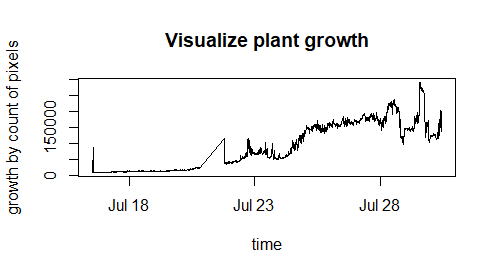
You can see in the graph that the plant is constantly growing. I didn’t perform any data cleansing. There are some outliers which could be eliminated. At the end of the observation period the graph doesn’t show the continuous growth. This is because the camera stands next to the plants and the they were growing just in front of the lens. And then not all plants could be seen but only the one which was next to the camera.
Learnings
In general, it is possible to measure plants growth with simple computer vision. To have better data results it could make sense to take less pictures, 10 minutes seems to be a little too often. A camera above the plants could help to get a view on all the plants.